
Understanding Logistic Regression Algorithm


REQUIREMENT
Before diving into this article, it's helpful to have some understanding of the math behind the Linear Regression algorithm. If you don’t, no need to worry; follow this article through!
INTRODUCTION
Logistic Regression is one of the first few classification algorithms that one uses to build a machine learning model, but only a handful of people truly understand the maths behind it.
We have made this article as simple as possible, in order to explain what Logistic Regression actually does.
Table of Contents
What is Logistic Regression?
Why the name Logistic ‘‘Regression’’?
Working of Logistic Regression
What is the Maximum Likelihood Estimation?
Assumptions of Logistic Regression
What is Logistic Regression?
If you recall, Linear Regression is used to determine/predict the continuous value of a dependent variable, and hence it is a regression algorithm. Whereas Logistic Regression, is generally used as a classification algorithm e.g. predicts something is true or false (binary classification).
What are Classification algorithms?
Classification algorithms are models used to predict discrete values or categories based on input data, assigning each instance to a specific class or group. For example, these algorithms can classify whether a patient has diabetes or not, categorize an email as spam or not, or recognize handwritten digits. Tasks like these are among the most common applications of classification.
Also in Linear Regression, the dependent variable is a set of continuous values but in Logistic Regression the dependent variable consists of only a specific set of values e.g 0/1, true/false, spam/ham, etc.
Types of Logistic Regression
Binomial Logistic Regression
Used for Binary Classification: The target variable can have only 2 possible outcomes like 0 or 1 which represent Obese/Not Obese, Dead/Alive, Spam/Not Spam, etc…Multinomial Logistic Regression
Used for Multi-class Classification: The target variable can have 3 or more possible outcomes e.g. Disease A/Disease B/Disease C or Digit Classification, etc...
In this article, we’ll focus on Binomial Logistic Regression which is commonly known as Logistic Regression.
Why the name Logistic ‘’Regression’’?
This the most common question asked by many students/beginners and here is my understanding of it. Logistic is abbreviated from the Logit function and its working is quite similar to that of a Linear Regression algorithm hence the name Logistic Regression.
Logistic Regression acts as a classification technique only when a decision threshold is applied. Without this threshold, it simply predicts probabilities, functioning more like a regression model.
The setting of the threshold value (default = 0.5) is a very important aspect of Logistic Regression and is dependent on the classification problem itself.
Working of Logistic Regression
Consider an example of classifying a patient is obese or not obese where if the output is 1 means the patient is obese and 0 means not obese.
Note: As Linear Regression uses the Ordinary Least Squares (OLE) method to select its best fit line, this can’t be done in the case of Logistic Regression and to know why; watch this video. Instead, Logistic Regression uses Maximum Likelihood to select the best fit line.
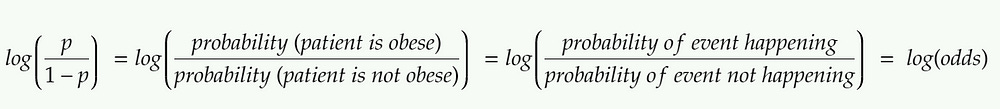
The Logistic Regression model firstly converts the probability into a log(odds) or log of odds as we call it, as shown in the figure below.
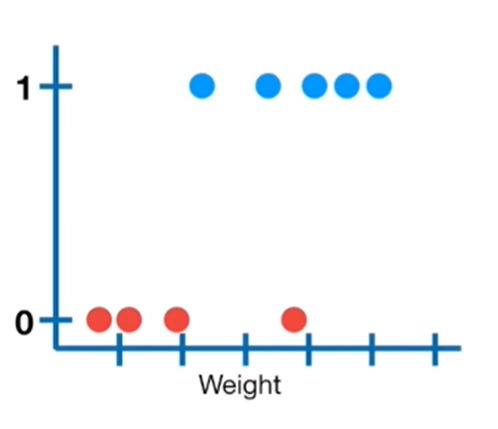
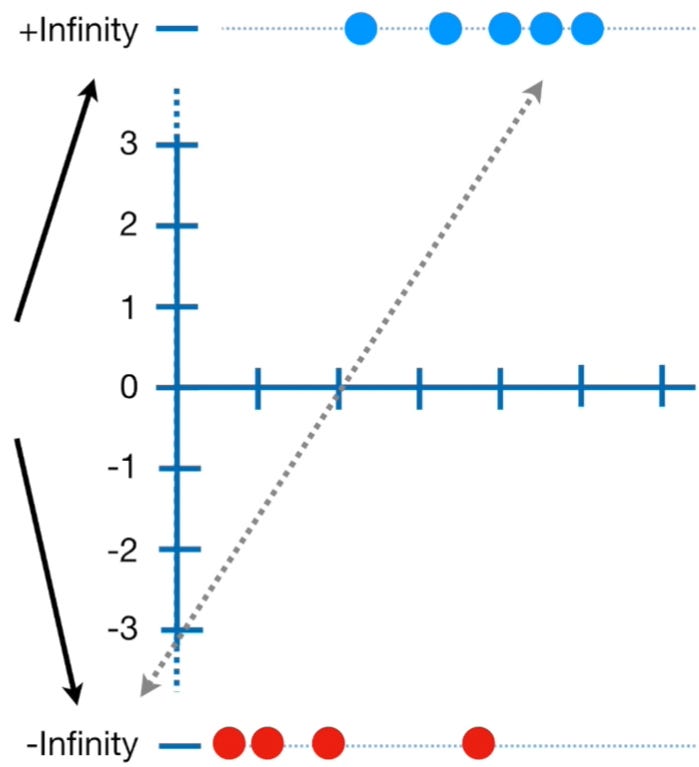
Conversion of probability to log(odds) || Image Source
Note: The y-axis of the left image consists of probability ranging from 0 to 1 with a default threshold value of 0.5 and the y-axis of the right image consists of the log(odds) values ranging from +infinity to -infinity. The conversion from probability to log(odds) is done using the logit function.
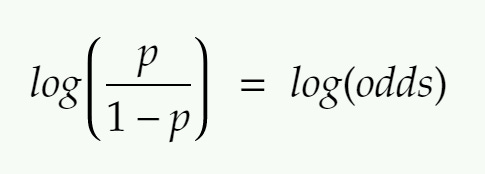
Logit function
Note: If we use the default threshold value = 0.5 and substitute in the above equation, we will end up with log(odds) = 0 which is the center of the log(odds) graph. Similarly, substituting 1 would give us the answer as +infinity whereas substituting 0 would give us the answer as -infinity.
Explanation of log(odds)
To find the log(odds) value for each candidate, we project them onto the line as shown below.
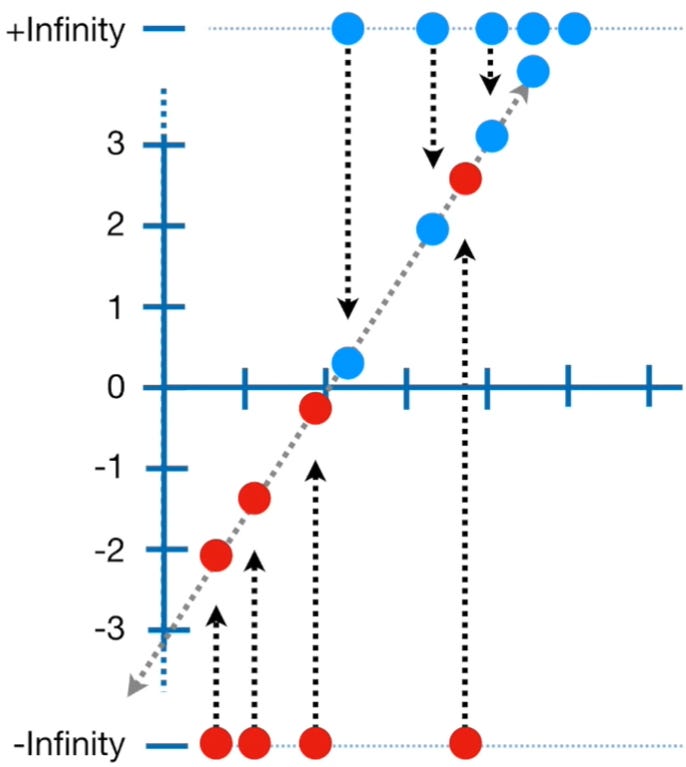
Log(odds) value of each datapoint || Image Source
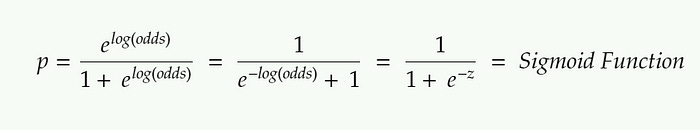
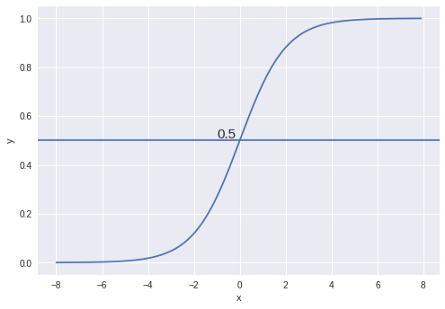
Once we find the log(odds) value for each candidate, we’ll convert back the log(odds) of each candidate to probability using the formula given below. (Sigmoid Function)
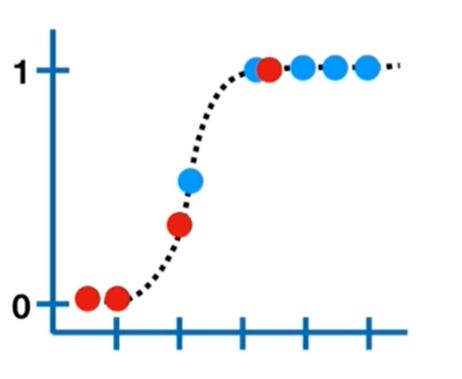
Sigmoid Function with decision threshold = 0.5 || Image Source
What is the Maximum Likelihood Estimation?
The Maximum Likelihood Estimation (MLE) is a likelihood maximization method, while the Ordinary Least Squares (OLS) is a residual minimizing method.
Maximizing the likelihood function determines the parameters that are most likely to produce the observed data. Hence maximum likelihood is used to select the best fit line.
The likelihood, in this case, is the product of probabilities of all the data points being obese and not obese.
On finding the likelihood for the first line, we then rotate the log(odds) line by a bit and again calculate the likelihood. This is done using the Gradient Descent algorithm.
This is how Logistic Regression works Phew…..

Assumptions of Logistic Regression
The dependent variable must be categorical.
The model should have little or no multicollinearity i.e. the independent variables should not be correlated with each other.
The independent variables are linearly related to the log(odds).
Logistic Regression requires quite large sample sizes.
References
Cost Function by internalpointers
Blog by Animesh Agarwal
 | A guest post by
|